quick start
- paplotをインストール
- testサンプルでコマンドを実行
- 結果ファイルを表示
1. paplotをインストール
ここではサーバサイドでのインストールを記載しています。
ここでうまくいかない方、個人のPCにインストールする方は install を参照してください。
HGCスパコンで使用する場合、事前に
qlogin してください。git clone -b master https://github.com/Genomon-Project/paplot.git
cd paplot
python setup.py build install --user
installの確認
以下を入力してください。
paplot conf
このように表示されればインストール成功です。
**********************
   hello paplot !!!
**********************

config file:/usr/lib/python2.7/site-packages/{paplot-versoion}-py2.7.egg/config/paplot.cfg
(このあとにデフォルト設定の内容が表示されます)
2. サンプルデータでコマンドを実行
サンプルデータを用意していますので実行します。
cd {paplotをインストールしたディレクトリ}

# create bar graphs of qc
paplot qc "example/qc/*.csv" ./tmp demo --config_file example/example.cfg

# create bundle graphs of Structural Variation (SV)
paplot ca "example/sv/*.txt" ./tmp demo --config_file example/example.cfg

# create matrix graphs of mutation
paplot mutation example/mutation/sample_merge.csv ./tmp demo --config_file example/example.cfg

# create signature graphs
paplot signature "example/signature/Nik_Zainal_2012.full.*.json" ./tmp demo --config_file ./example/example.cfg

# create signature graphs (pmsignature)
paplot pmsignature "example/pmsignature/Nik_Zainal_2012.ind.*.json" ./tmp demo --config_file ./example/example.cfg
3. 結果ファイルを表示
HTMLファイルができていますか?
{paplot をインストールしたディレクトリ}
└ tmp
├ demo
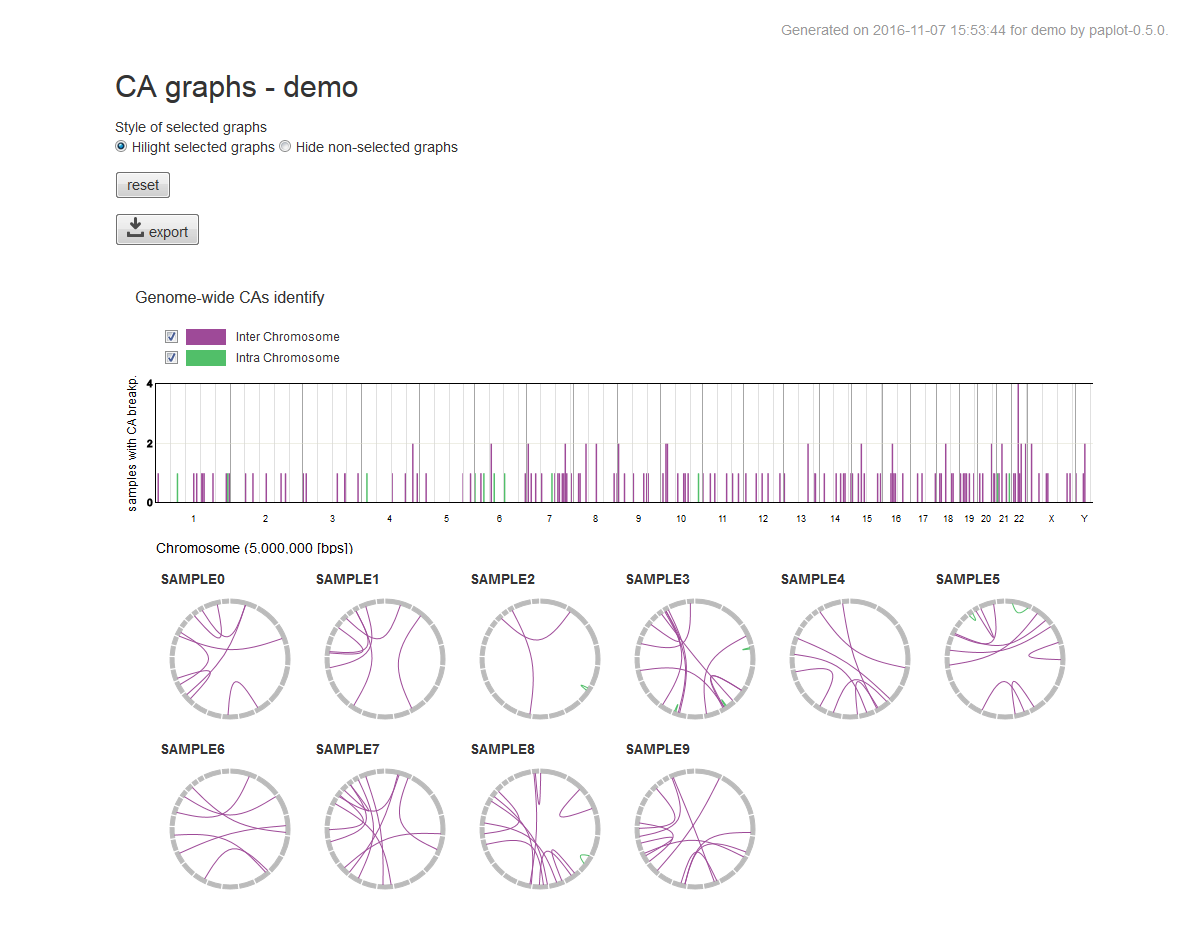
│ ├ graph_ca.html <--- ca グラフ
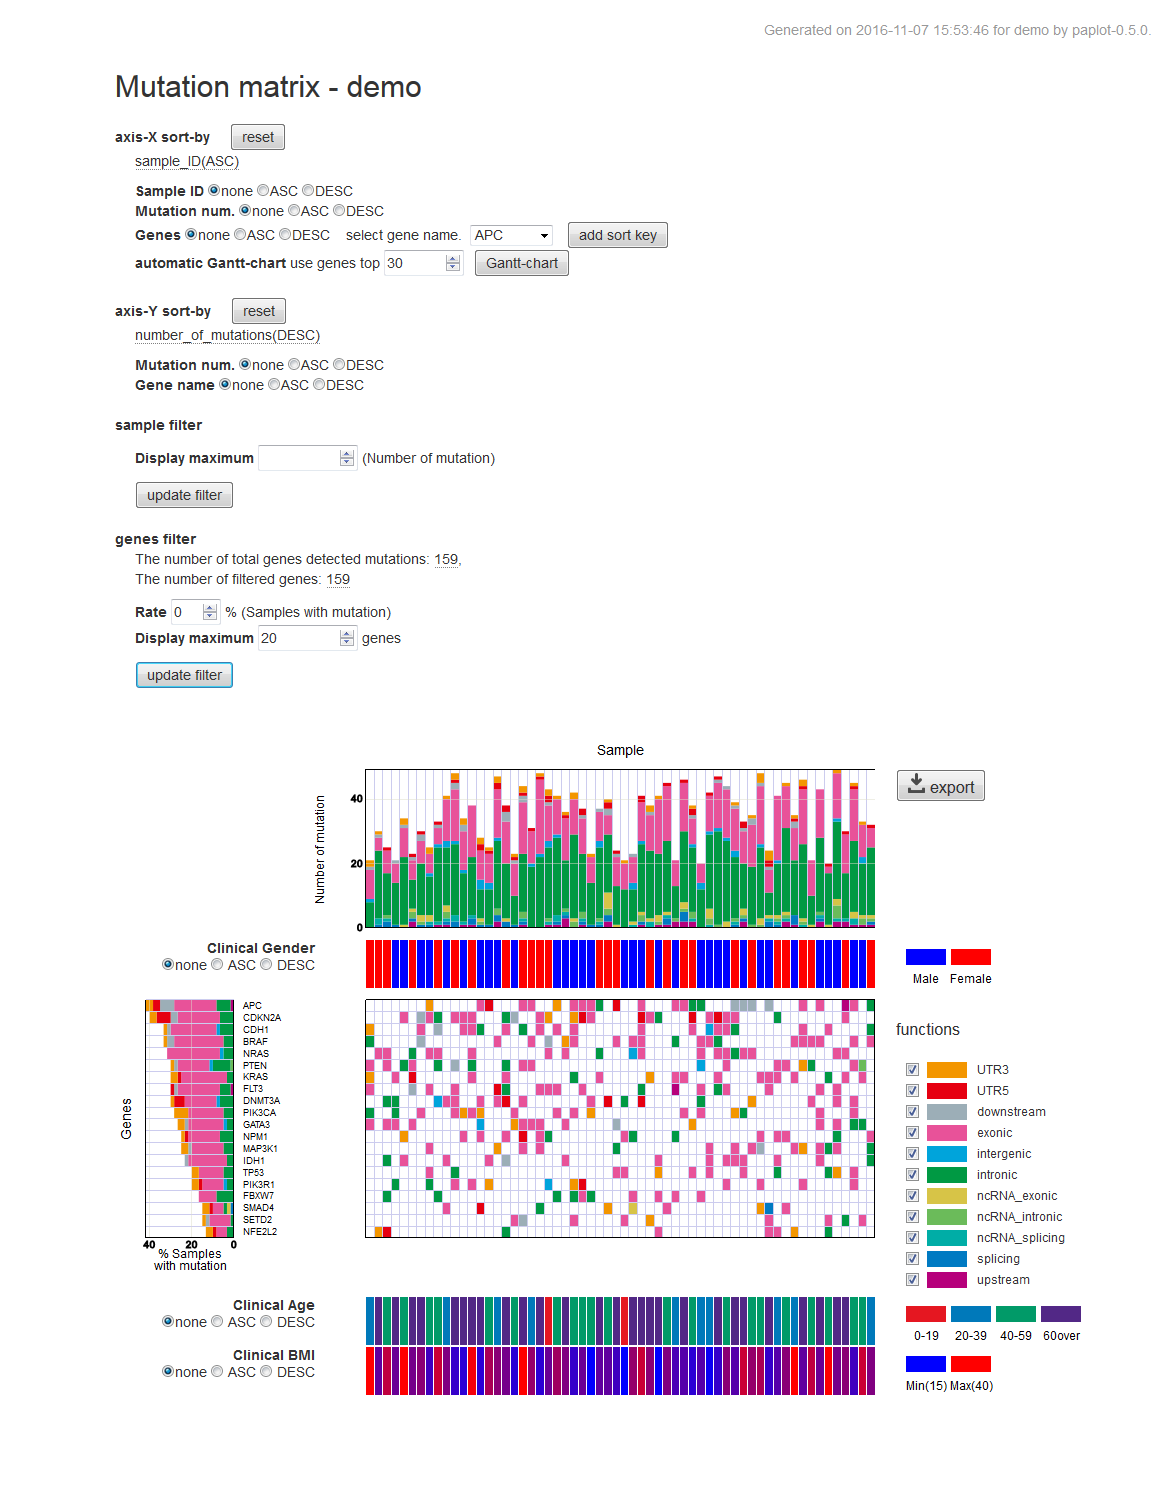
│ ├ graph_mut.html <--- mutation-matrix グラフ
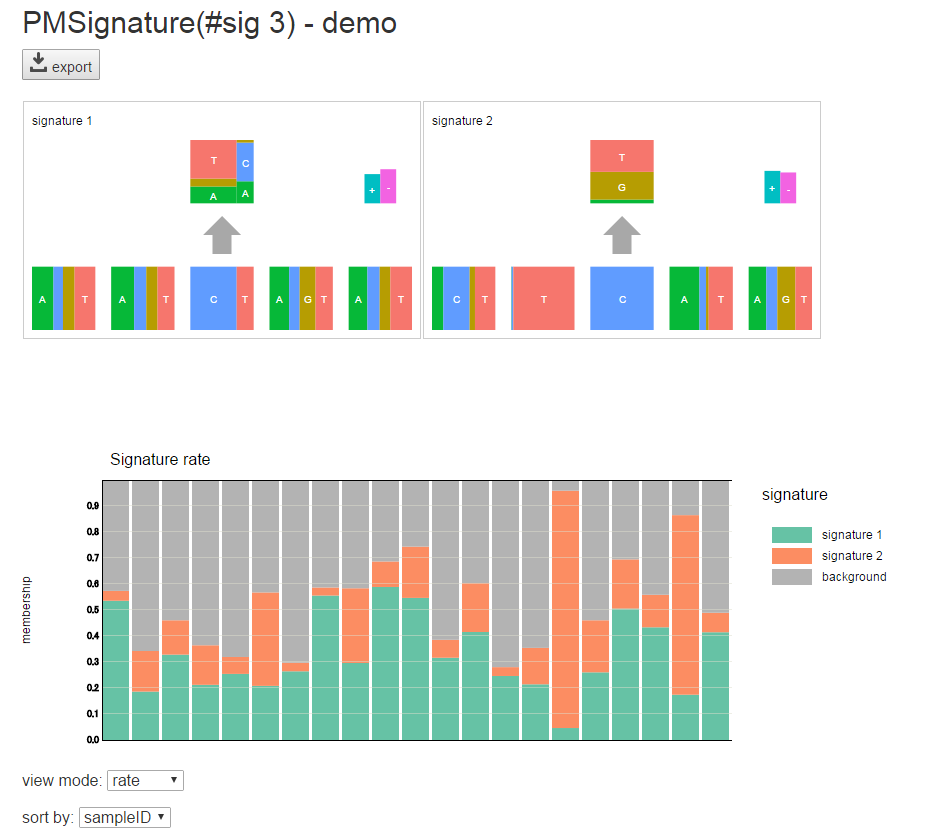
│ ├ graph_pmsignature2.html <--- pmsignature グラフ (数字はsignature数)
│ ├ graph_pmsignature3.html
│ ├ graph_pmsignature4.html
│ ├ graph_pmsignature5.html
│ ├ graph_pmsignature6.html
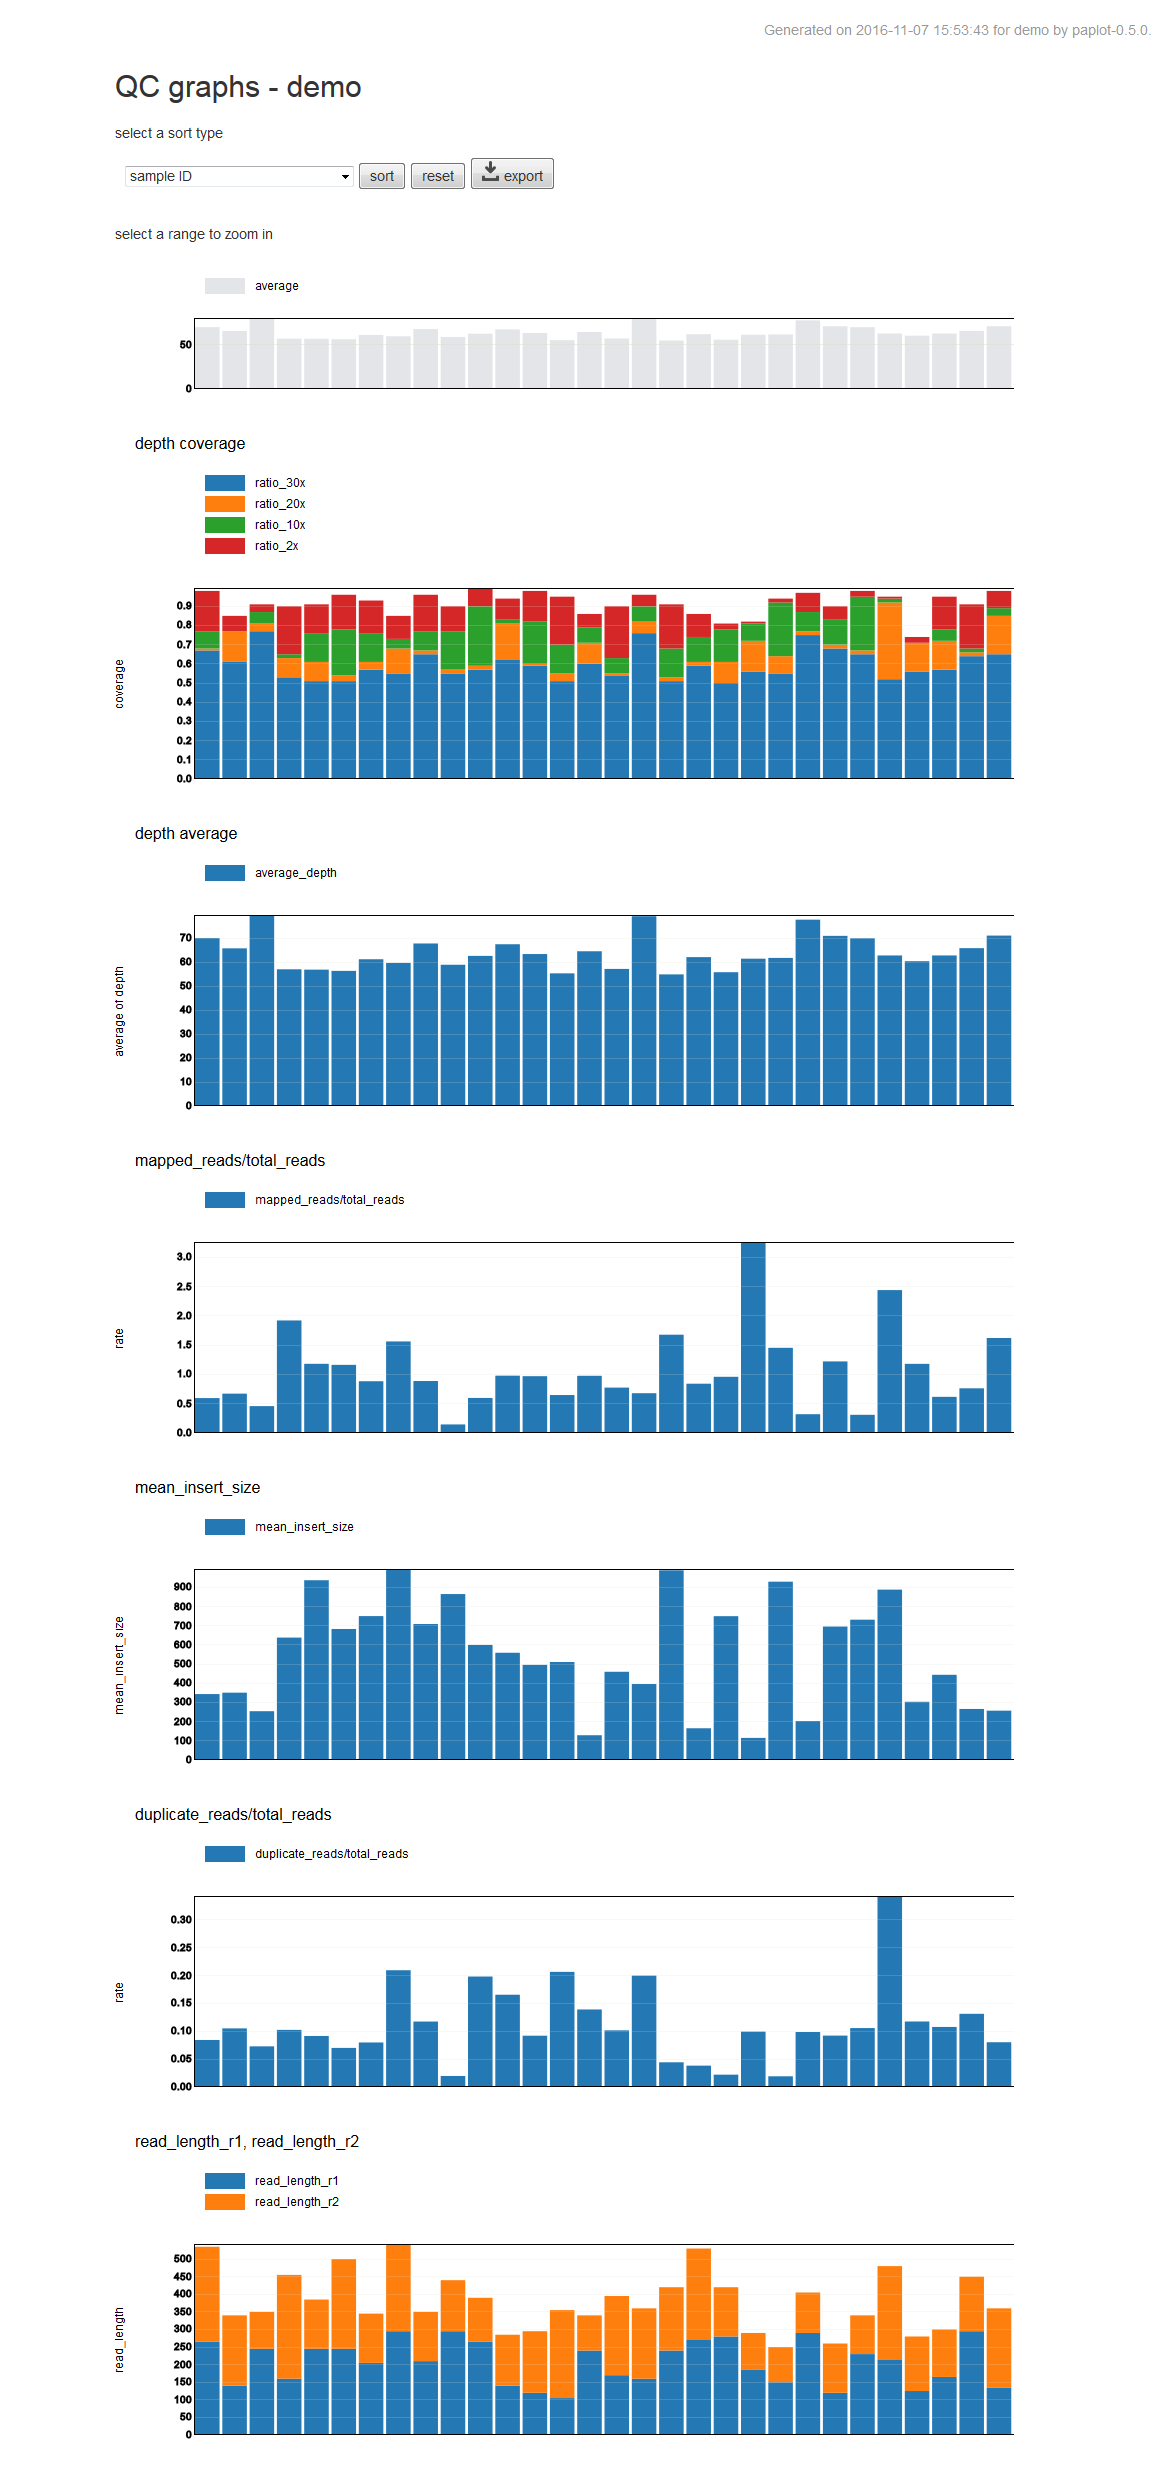
│ ├ graph_qc.html <--- qc グラフ
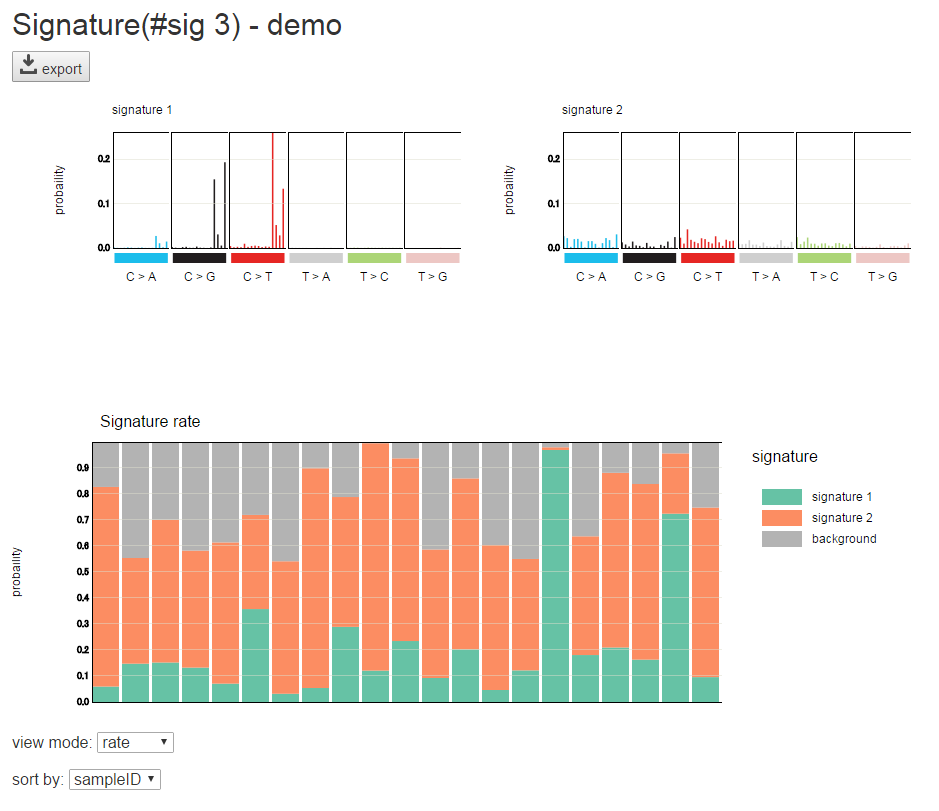
│ ├ graph_signature2.html <--- signature グラフ (数字はsignature数)
│ ├ graph_signature3.html
│ ├ graph_signature4.html
│ ├ graph_signature5.html
│ └ graph_signature6.html
│
├ js <--- この4つのディレクトリはHTMLファイルを表示するために必要です。消さないでください。
├ layout
├ lib
├ style
│
└ index.html <--- このファイルを web ブラウザで開いてください。
index.htmlファイルを web ブラウザで開いてください。
※HGCスパコン等、サーバ上で実行した場合はファイルをローカルに転送するか、サーバ上の仮想ウィンドウ(NoMachime等)で表示してください。
ローカルに転送する場合は、
tmp ディレクトリを丸ごとコピーしてください。次のように見えていますか?
QC グラフ
CA グラフ
mutation-matrix グラフ
signature グラフ 
pmsignature グラフ
それぞれのグラフの使い方は how to use graphs を参照してください。