Config 記述方法 (mutation-matrix)
全設定項目は こちら
列と設定の対応
| name | input type | required | description |
|---|---|---|---|
| col_func | text | o | mutation type |
| col_gene | text | o | gene name |
| col_opt_chr | text | x | chromosome |
| col_opt_start | numeric | x | 開始位置 |
| col_opt_end | numeric | x | 終了位置 |
| col_opt_ref | text | x | リファレンスの塩基配列 |
| col_opt_alt | text | x | 対象の塩基配列 |
| col_opt_id | text | x | サンプルを識別できる名称 |
ポップアップウィンドウの表示内容
| {#number_id}: | サンプル数 |
|---|---|
| {#number_gene}: | 遺伝子数 |
| {#number_mutaion}: | |
| mutation数(同一サンプルが同一遺伝子で複数回検出されても1としてカウントする) | |
| {#sum_mutaion}: | mutation総検出数 |
| {#item_value}: | 積み上げグラフの1項目の値 |
| {#sum_item_value}: | |
| 積み上げグラフの合計値 | |
mutationの集計について、使用しなかったmutationはカウントしていません。
Genomonでは、functionが次の場合のmutationを除外していますので、それぞれの項目の値は全検出結果からこれらの数を引いた値になります。
nouse_funcs = _blank_,unknown,synonymous_SNV
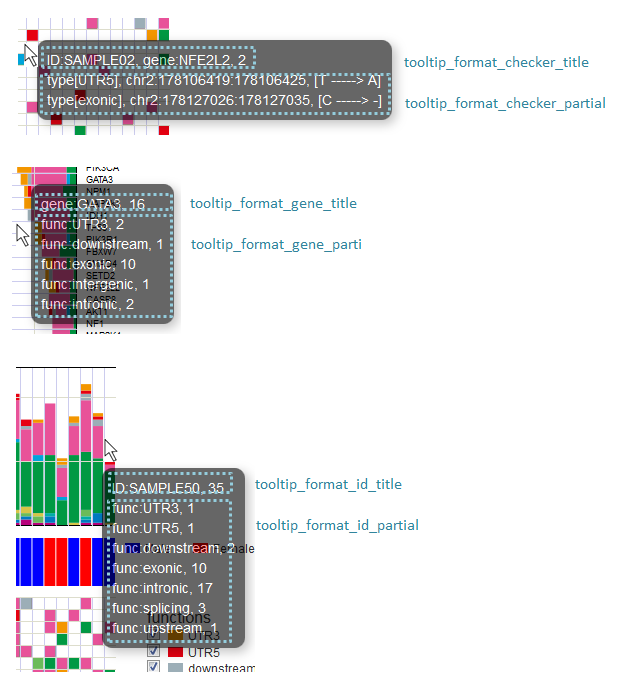
デフォルトでの設定内容と表示との対応
# グリッド - タイトル
tooltip_format_checker_title1 = ID:{ID}, gene:{gene}, {#sum_item_value}

# グリッド - funcごと
tooltip_format_checker_partial = type[{func}], {chr}:{start}:{end}, [{ref} -----> {alt}]

# 遺伝子グラフ - タイトル
tooltip_format_gene_title = gene:{gene}, {#sum_item_value}

# 遺伝子グラフ - funcごと
tooltip_format_gene_partial = func:{func}, {#item_value}

# サンプルグラフ - タイトル
tooltip_format_id_title = ID:{id}, {#sum_item_value}

# サンプルグラフ - funcごと
tooltip_format_id_partial = func:{func}, {#item_value}
サブプロットについて
mutation-matrixグラフでは解析結果とは別にサンプルに対する情報を表示することができます。
表示場所は2つあり、type1はサンプルグラフの下に、type2は最後に表示します。
type1を表示する場合はセクション名を[mut_subplot_type1_*]とします。
type2を表示する場合はセクション名を[mut_subplot_type2_*]とします。
* には1から始まる連番を入れてください。1から順に表示します。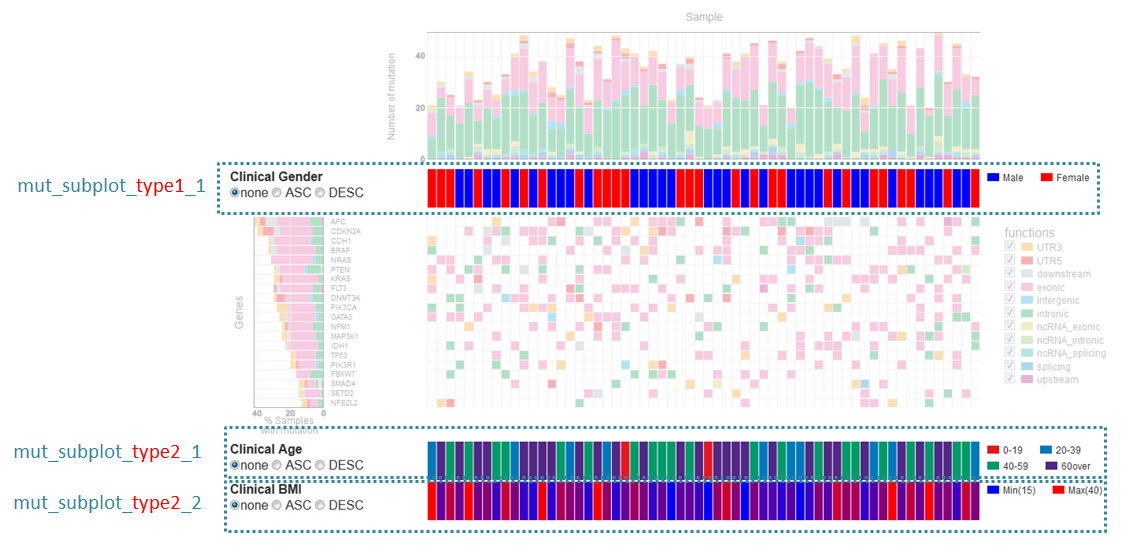
1 2 3 4 5 6 7 8 9 10 11 12 13 14 15 16 17 18 19 20 21 22 23 24 25 26 27 28 29 30 31 32 33 34 35 36 37 38 39 40 41 42 43 44 45 46 47 48 49 50 51 52 53 54 55 56 57 58 59 60 61 62 63 64 65 66 67 68 69 70 71 72 73 | # mut_subplot_type1_1
[mut_subplot_type1_1]
# ファイルのパス
path = /path/to/file1
###########################
# ファイルフォーマット
# ファイルのデータ区切り
sept = ,
# 先頭1行がヘッダかどうか
header = True
# コメント行
comment = #
# 表示データの列
col_value = average_depth
# id 列(main plotと紐づけられること)
col_ID = id
###########################
# サブプロットのフォーマット
# サブプロットのタイトル
title = bam's average depth
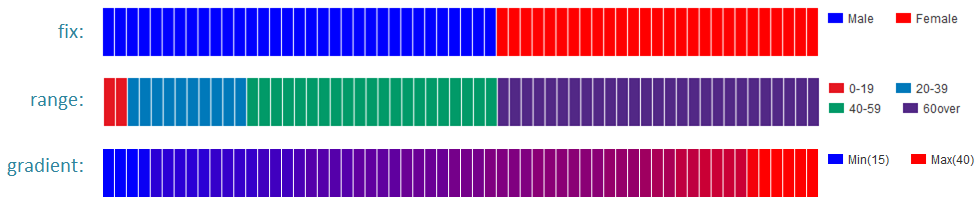
# 表示形式
# fix, range, gradientから選択
mode = gradient
# 凡例のフォーマット
# 値:表示文字列:セルの色を各値ごとに記入する。セルの色は省略可能
#
# mode = fixの場合
# name_set = 0:Male:blue, 1:Female:red, 2:Unknown:gray
#
# mode = rangeの場合、値には範囲開始の値を入れる
# name_set = 0:0-19, 20:20-39, 40:40-59, 60:60over
#
# mode = gradientの場合、最初と最後の値を入れる。MIN/MAXを使用すると、データから自動的に設定する
# 自動設定の場合
# name_set = MIN:min, MAX:max
# 手動設定の場合
# name_set = 0:min (0), 40:max (40)
name_set = MIN:min, MAX:max
# mut_subplot_type2_1
[mut_subplot_type2_1]
title = Clinical Gender
path = /path/to/file2
sept = ,
header = True
comment =
col_value = gender
col_ID = barcode
mode = fix
name_set = 0:Male:blue, 1:Female:red, 2:Unknown:gray
#mut_subplot_type2_2
[mut_subplot_type2_2]
title = Clinical Age
path = /path/to/file3
sept = ,
header = True
comment =
col_value = age
col_ID = barcode
mode = range
name_set = 0:0-19, 20:20-39, 40:40-59, 60:60over
|
titleとnameset

表示モードの違い